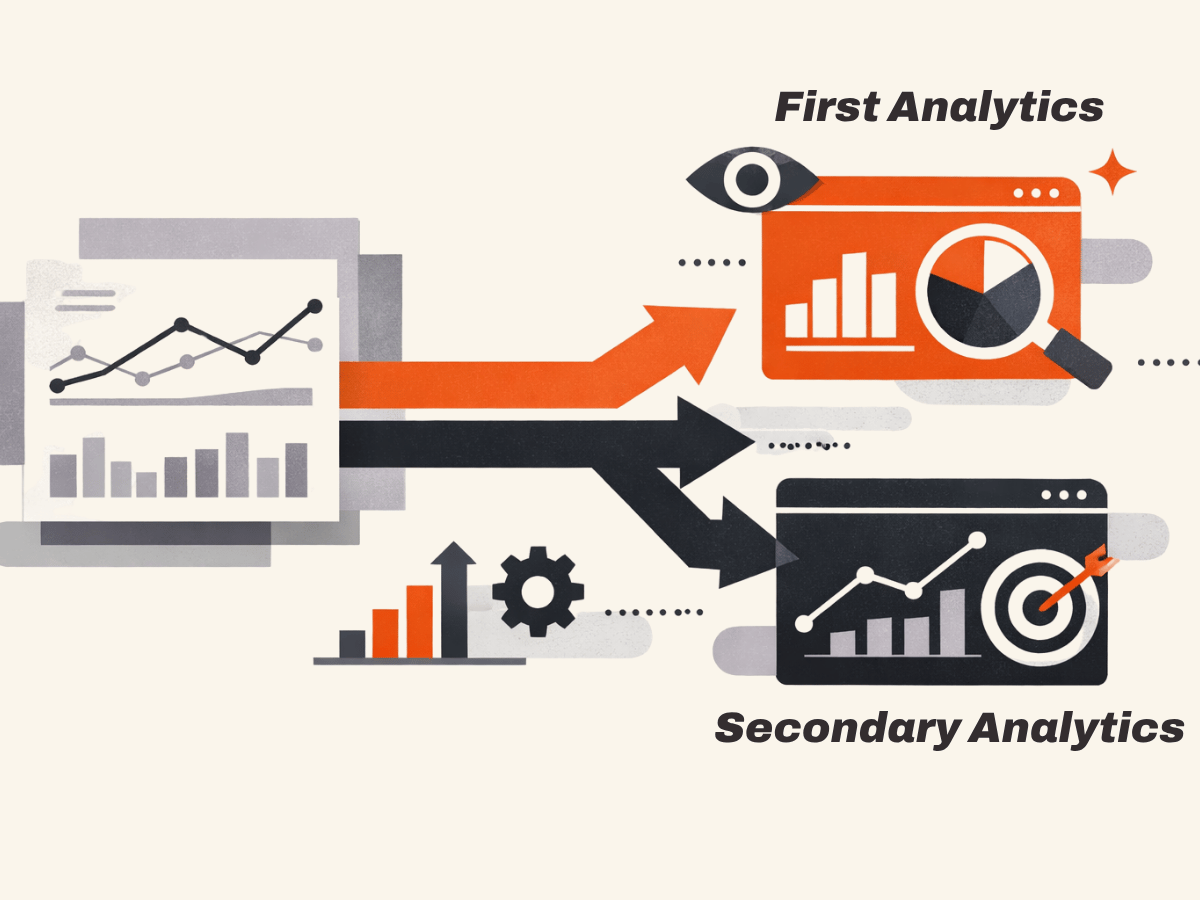
What Are the Best Custom Reports and Dashboards to Set Up in Google Analytics?
Getting the most out of Google Analytics is vital to understanding your company’s performance. Here, you will learn how to create your own Google Analytics custom reports and dashboards, and will be shown examples to inspire you. But first, you’ll need to know the basics.
 What is a Dimension in Google Analytics?
Dimensions are qualitative aspects of your data.
Dimensions are attributes of your data. For example, the dimension City indicates the city, for example, “Paris” or “New York”, from which a session originates. The dimension Page indicates the URL of a page that is viewed.
What are Metrics in Google Analytics?
Metrics are quantitative aspects of your data.
Metrics are quantitative measurements. The metric Sessions is the total number of sessions. The metric Pages/Session is the average number of pages viewed per session.
Google Analytics Custom Reports
What is a Report in Google Analytics?
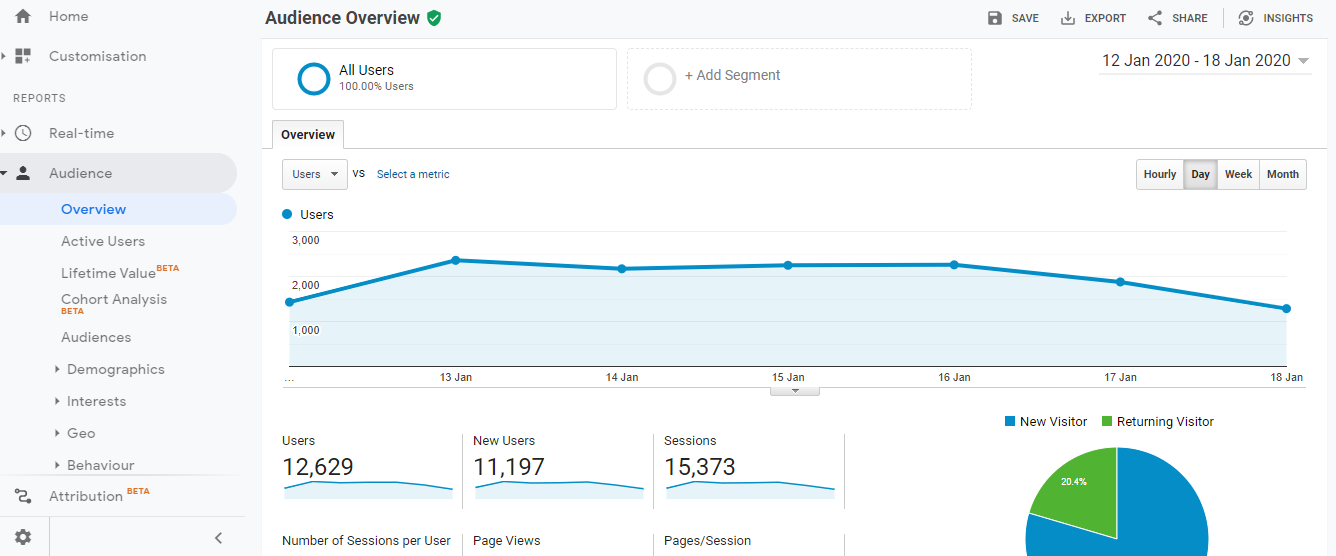
A report is a summary of the information created by combining various groups of dimensions and metrics. Standard reports are the preset reports in Google Analytics. These are segmented into Real-Time, Audience, Acquisition, Behaviour and Conversions reports. They include the standard Referrals report, Campaigns report and Events report for example. The data in these reports is predetermined by Google Analytics but you also have the option to customise them somewhat.
Not all dimension-metric combinations are valid for reports. Each piece of data has a scope, either user-level, session-level, hit-level or product scope (such as a product name, price or category). Most of the time, you can only combine dimensions and metrics of the same level. The user-level is considering one individual customer using your site. Each time they use your site, that’s a session, and each interaction is a hit, where session-level and hit-level data is respectively collected.
It can be difficult to determine which metrics and dimensions apply to which level but you can use this Google Analytics Tool to determine which combinations are valid.
How to Set Up a Custom Report in Google Analytics
There are three main ways to make a report in Google Analytics. These are:
- Create manually
- Import from the Solutions Gallery
- Edit standard reports
Each of these methods have different levels of difficulty, so we’ve laid out each method in detail below for you to decide what’s best for your needs.
Method One: Create Manually
This method requires a higher level of knowledge and experience with Google Analytics but it gives you the most personalised look at your data.
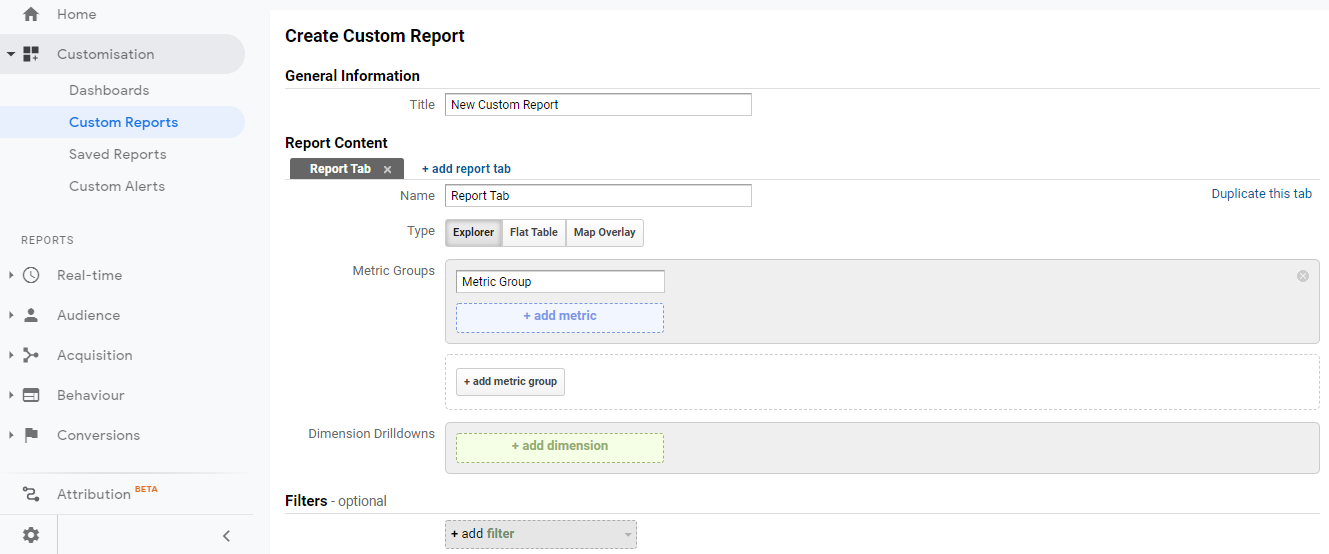
- In Google Analytics, select the property then view in which you want to create your custom report.
- Select Customization, then Custom Reports, then +New Custom Report.
- Give your report a title.
- You can then select +add report tab, if you want more than one.
- Choose a report type for each report tab. These include Explorer, providing the standard report, Flat Table, which gives a basic table, Map Overlay, which is a world map, coloured according to the metric you selected, and Funnel (only for GA360 users), a conversion funnel that you set the parameters for.
- Choose your metrics, dimensions, and secondary dimensions, which further break down your originals.
- You can choose to select +add filter, restricting the data that appears on your report.
- Hit Save.
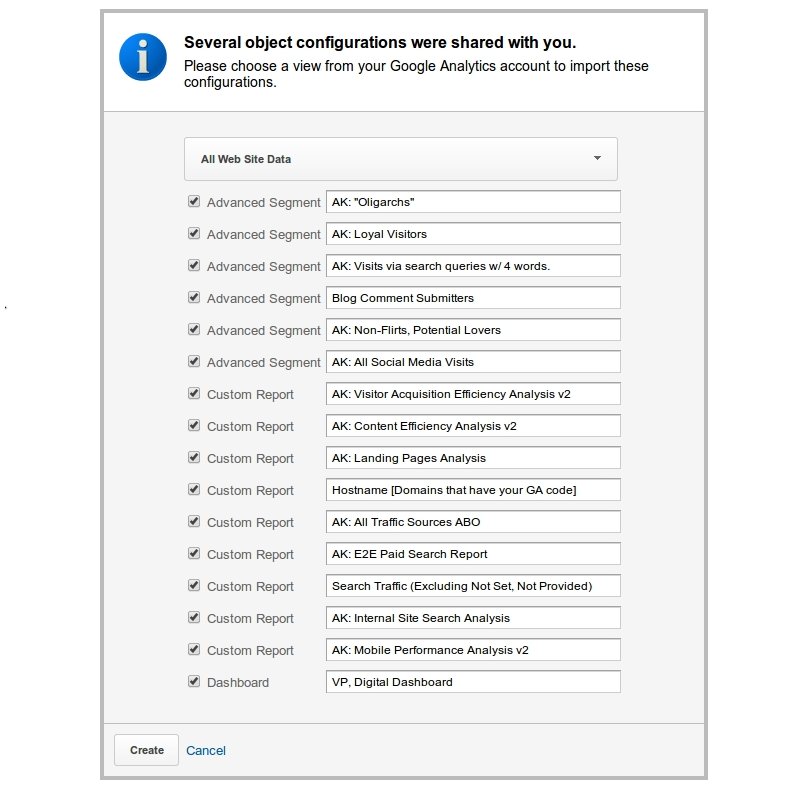
Method Two: Import from the Solutions Gallery
The Solutions Gallery is a database full of custom reports created and shared by other users. You can use these as a starting point to model your own data onto.
- Start by finding a report to use.
- Select import on your chosen report.
- Choose a view from your account.
- Choose the data you want in the report, if not all.
- Hit Create.

Method Three: Edit Saved Reports
In certain standard reports in Google Analytics you can choose to edit the report in order to customise it. For example, in the Channels report under Acquisition and All Traffic, you can select “edit”. You will then have access to the blueprint of the existing report that you can tweak to your own needs.
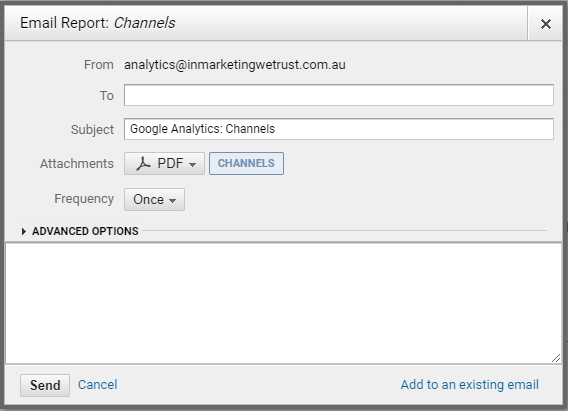
Sharing Your Reports
You can share your Google Analytics report or parts of it by saving and exporting or more simply sharing by email. You can also share your report automatically at set intervals to keep stakeholders engaged and aware. Or you may want to share so others in the team can use the same custom report. You can share this way via link or via the Solutions Gallery.
Best Google Analytics Custom Reports
Google Analytics Reports Examples
Manual Custom Report Example
There are endless custom reports to be made in Google Analytics. One that we use regularly at In Marketing We Trust is our 404 report. We created a custom report that shows us the 404 pages that occurred on our site. To do this, we created a dedicated event that is triggered whenever a 404 occurs.
This custom report shows how many times a non-existing page has been seen. The report is automatically sent to the team every week (each Monday). This enables us to regularly implement new redirects and monitor errors occurring on our website.

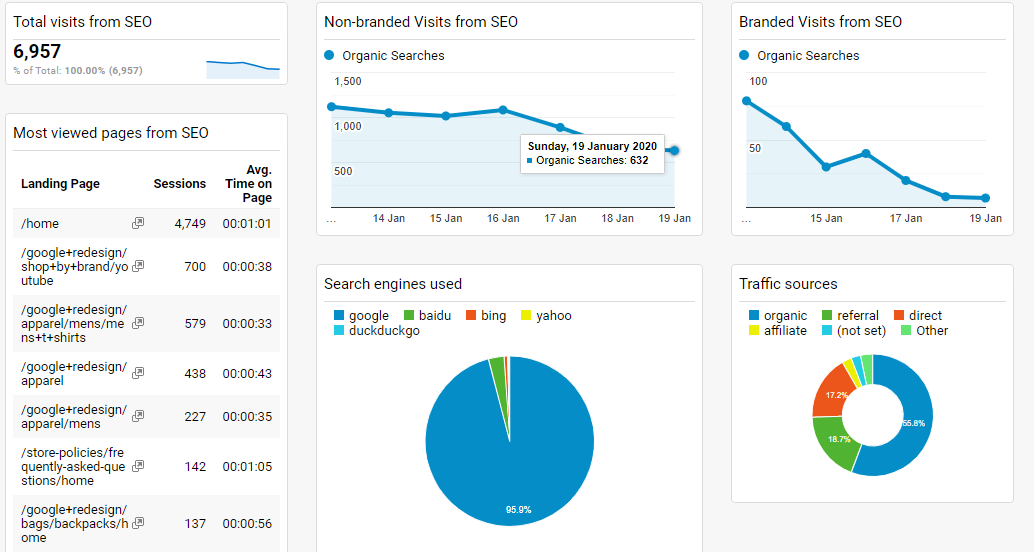
Solutions Gallery Report Example
Occam’s Razor Awesomeness is one of our favourite custom reports in the Solutions Gallery. With 210 5-star ratings, it’s a lot of other people’s favourite too. This is a collection of Avinash Kaushik’s top Segments, custom reports and dashboards, deemed critical for any Google Analytics user.
Edited Report Example
For most custom reports, you’ll want to start from scratch using “custom reports” in the Customization dropdown in Google Analytics. If you’re only looking for a simple solution and just want to add a metric or two to a standard report, then you can do it by clicking on the edit button.
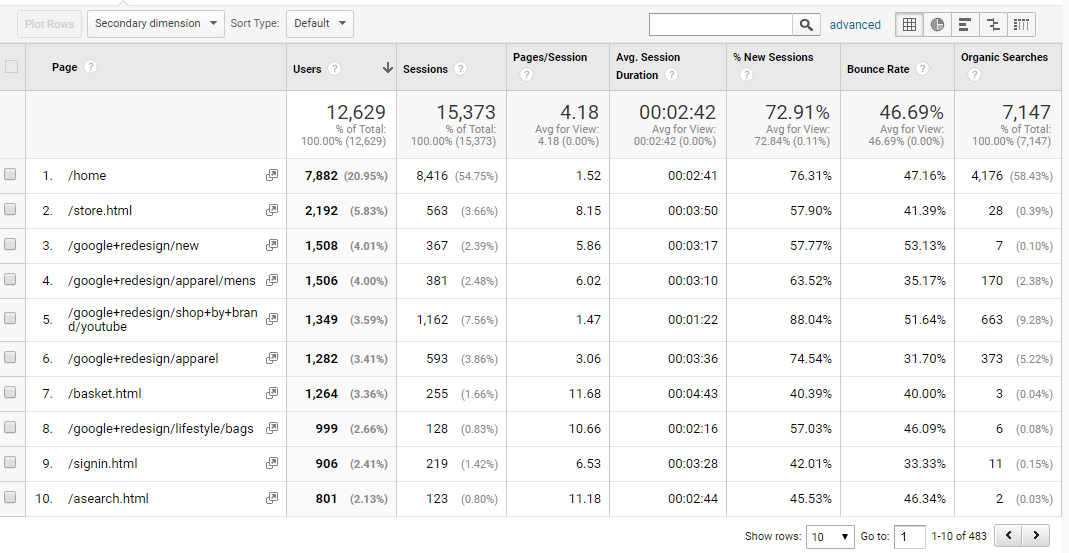
For example if you wanted to see the amount of organic searches a page had in the All Traffic report, you could select edit, add organic searches under site usage and then add page as the dimension. Once the report has been created in custom reports, select Site Usage, next to the Summary.
Common Report Mistakes and How to Avoid Them
With Google Analytics reports, it can be easy to make mistakes. Use this as a guide to avoid and troubleshoot problems.
Most common reporting mistakes in Google Analytics:
- The most common issue is a mismatch of scopes. If you create an invalid dimension-metric combination, the data can be misleading or you might find yourself looking at empty space where data should be. Make sure you understand the minor differences between dimensions.
- Thinking the data is shared with a shared custom report. This is another common error in thinking when it comes to Google Analytics. You may receive a custom report from someone that will appear empty when you load it as you do not have the same setup or they may use custom dimensions and metrics you do not.
- Another common misconception is that different filters can be applied to different tabs in a custom report. The filters in custom reports are in fact applied on all of the existing tabs.
Google Analytics Dashboards
What is a Dashboard in Google Analytics?
Your Google Analytics dashboard brings together widgets that provide an overview of the data and reports that are most important to you. They allow you to see multiple factors at once, and determine correlations between your reports.
How to Set Up a Dashboard in Google Analytics
- In Google Analytics, select the property then view in which you want to create your dashboard.
- Select Customization, followed by Dashboards.
- Select Create.
- Choose between Blank Canvas, which has no widgets to start you off, or Starter Dashboard, which provides you with the defaults. Additionally, you could import a dashboard from the Solutions Gallery.
- Give your dashboard a title.
Create Widgets for Your Dashboard
Once you’ve created a new dashboard you’ll need to choose your widgets. There are six types of widgets and you can use up to 12 widgets per dashboard.
Types of Widgets
- Metric gives basic numerical data surrounding a single metric.
- Timeline gives a line graph of a single metric over time
- Pie creates a pie chart concerning a metric paired with a dimension
- Bar makes a bar graph of a metric paired with one or two dimensions.
- Geomap gives a map of a region, with details concerning traffic and other location-based factors
- Table pairs a dimension with up to two metrics.
How to Add Widgets to Your Google Analytics Dashboard
- Select +Add Widget on an existing dashboard.
- Select the type of widget you want.
- Set up the dimensions, metrics and other factors that affect the widget.
- You can choose to add a filter to restrict the data that will appear in your dashboard.
- Give the widget a title.
- Select Save.
Creating widgets like this can give a personalised view of your analytics, but just like custom reports, using the Solutions Gallery or editing widgets that have been shared with you is a great way to find a new approach.
Best Google Analytics Dashboards
Examples of Dashboards
Manual Dashboard Example
We have created a very simple dashboard that shows page views by page type in a bar chart to easily view how certain pages are performing. For example, we can easily see how our resources section performs against our corporate pages in terms of traffic.
We can also get a quick overview of how our results, services and partners (Google & Adobe) pages are performing. This might be the kind of information you’d like to include in your own custom dashboard.
Solutions Gallery Dashboard Example
You can import individual widgets or a whole dashboard. This example in the Solutions Gallery by Justin Cutroni is great for tracking your site performance whether you’re simply running a blog or an eCommerce store. You’ll be able to identify potential problems with your site’s speed and performance.
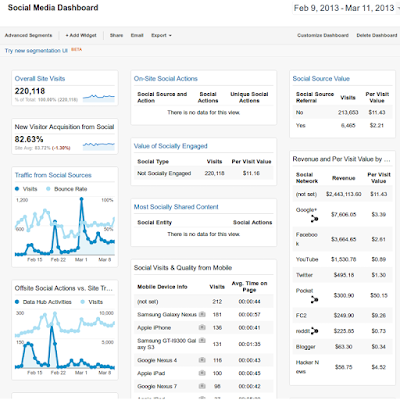
Edited Dashboard Example
Editing a general dashboard like this social media dashboard by Justin Cutroni is a great way to get yourself started with a good foundation. This dashboard gives you a view of off-site activity, on-site activity and conversions/outcomes.
Common Dashboard Mistakes and How to Avoid Them
An important part of choosing which widgets make a good Google Analytics dashboard is to decide what would really benefit from a visual representation, and which components you will check often.
The dashboard doesn’t tell you anything you can’t find in your reports, so it’s important to understand what will be helpful here. Really, it’s a place to keep all your most important metrics so you can easily find and visualise them, without having to go through an entire report.
Having a dashboard that only shows the bare minimum is also essential. If it’s a cluttered, confusing space, the important data will get lost. Give your most important data the space it deserves. Also, make sure you’re choosing the right widget for the job, as there’s no point in making a map out of what should be a pie chart.
Include all the information you can about what your data is saying, and ensure it conveys your big picture ideas. If you manage to do that through your dashboards and reports, you will be well placed to focus on optimising those numbers, including revenue.