A customer journey map is a vital part of ensuring your business is creating a positive user experience. It is a visual aid, summarising all the touchpoints consumers have with your company, from initial brand awareness to post-purchase marketing. Not only does it highlight these touchpoints, but the transitions between them, so as to get a full view of user journeys. The goal of these customer experience maps is to get you to think like your client base, to feel the way they do throughout their time interacting with your business and make the necessary changes to accommodate them. This customer-centric view allows you to streamline the user experience.
This guide is to help you create your own customer journey map, from basic steps that break down the process to implementing the necessary changes. You will end up with a more thorough view of the user experience by combining both qualitative and quantitative data. This will enable you to discover which parts of your business model are difficult for consumers to navigate, and how to improve.
Create an Effective Customer Journey Map
To create the ultimate journey map, you must determine the following:
- Your customer personas
- The phases of the user journey
- Customer goals
- Your touchpoints
- Your pain points
- The course of action
These six steps will give you a better understanding of the customer experience, and are essential for your CRO strategy.
Step One: Your Customer Personas
Personas are used to represent the demographic groups of your client base. They are the first step towards entering the mind of the consumer. The best way to create these models is to examine the customer information you already have and to complete further research if required. You will need to focus on the psychographics of your users more than factors such as age, gender and financial ability. While these are important to consider in the overall model, a greater emphasis should be placed on the attitudes, behaviours and morals of the users.
Gathering Your Data
What is likely to be missing from your existing research surrounding you customers is qualitative data. While quantitative data encompasses all your numerical data and analytics, qualitative data is predominantly made up of experiences and interactions.
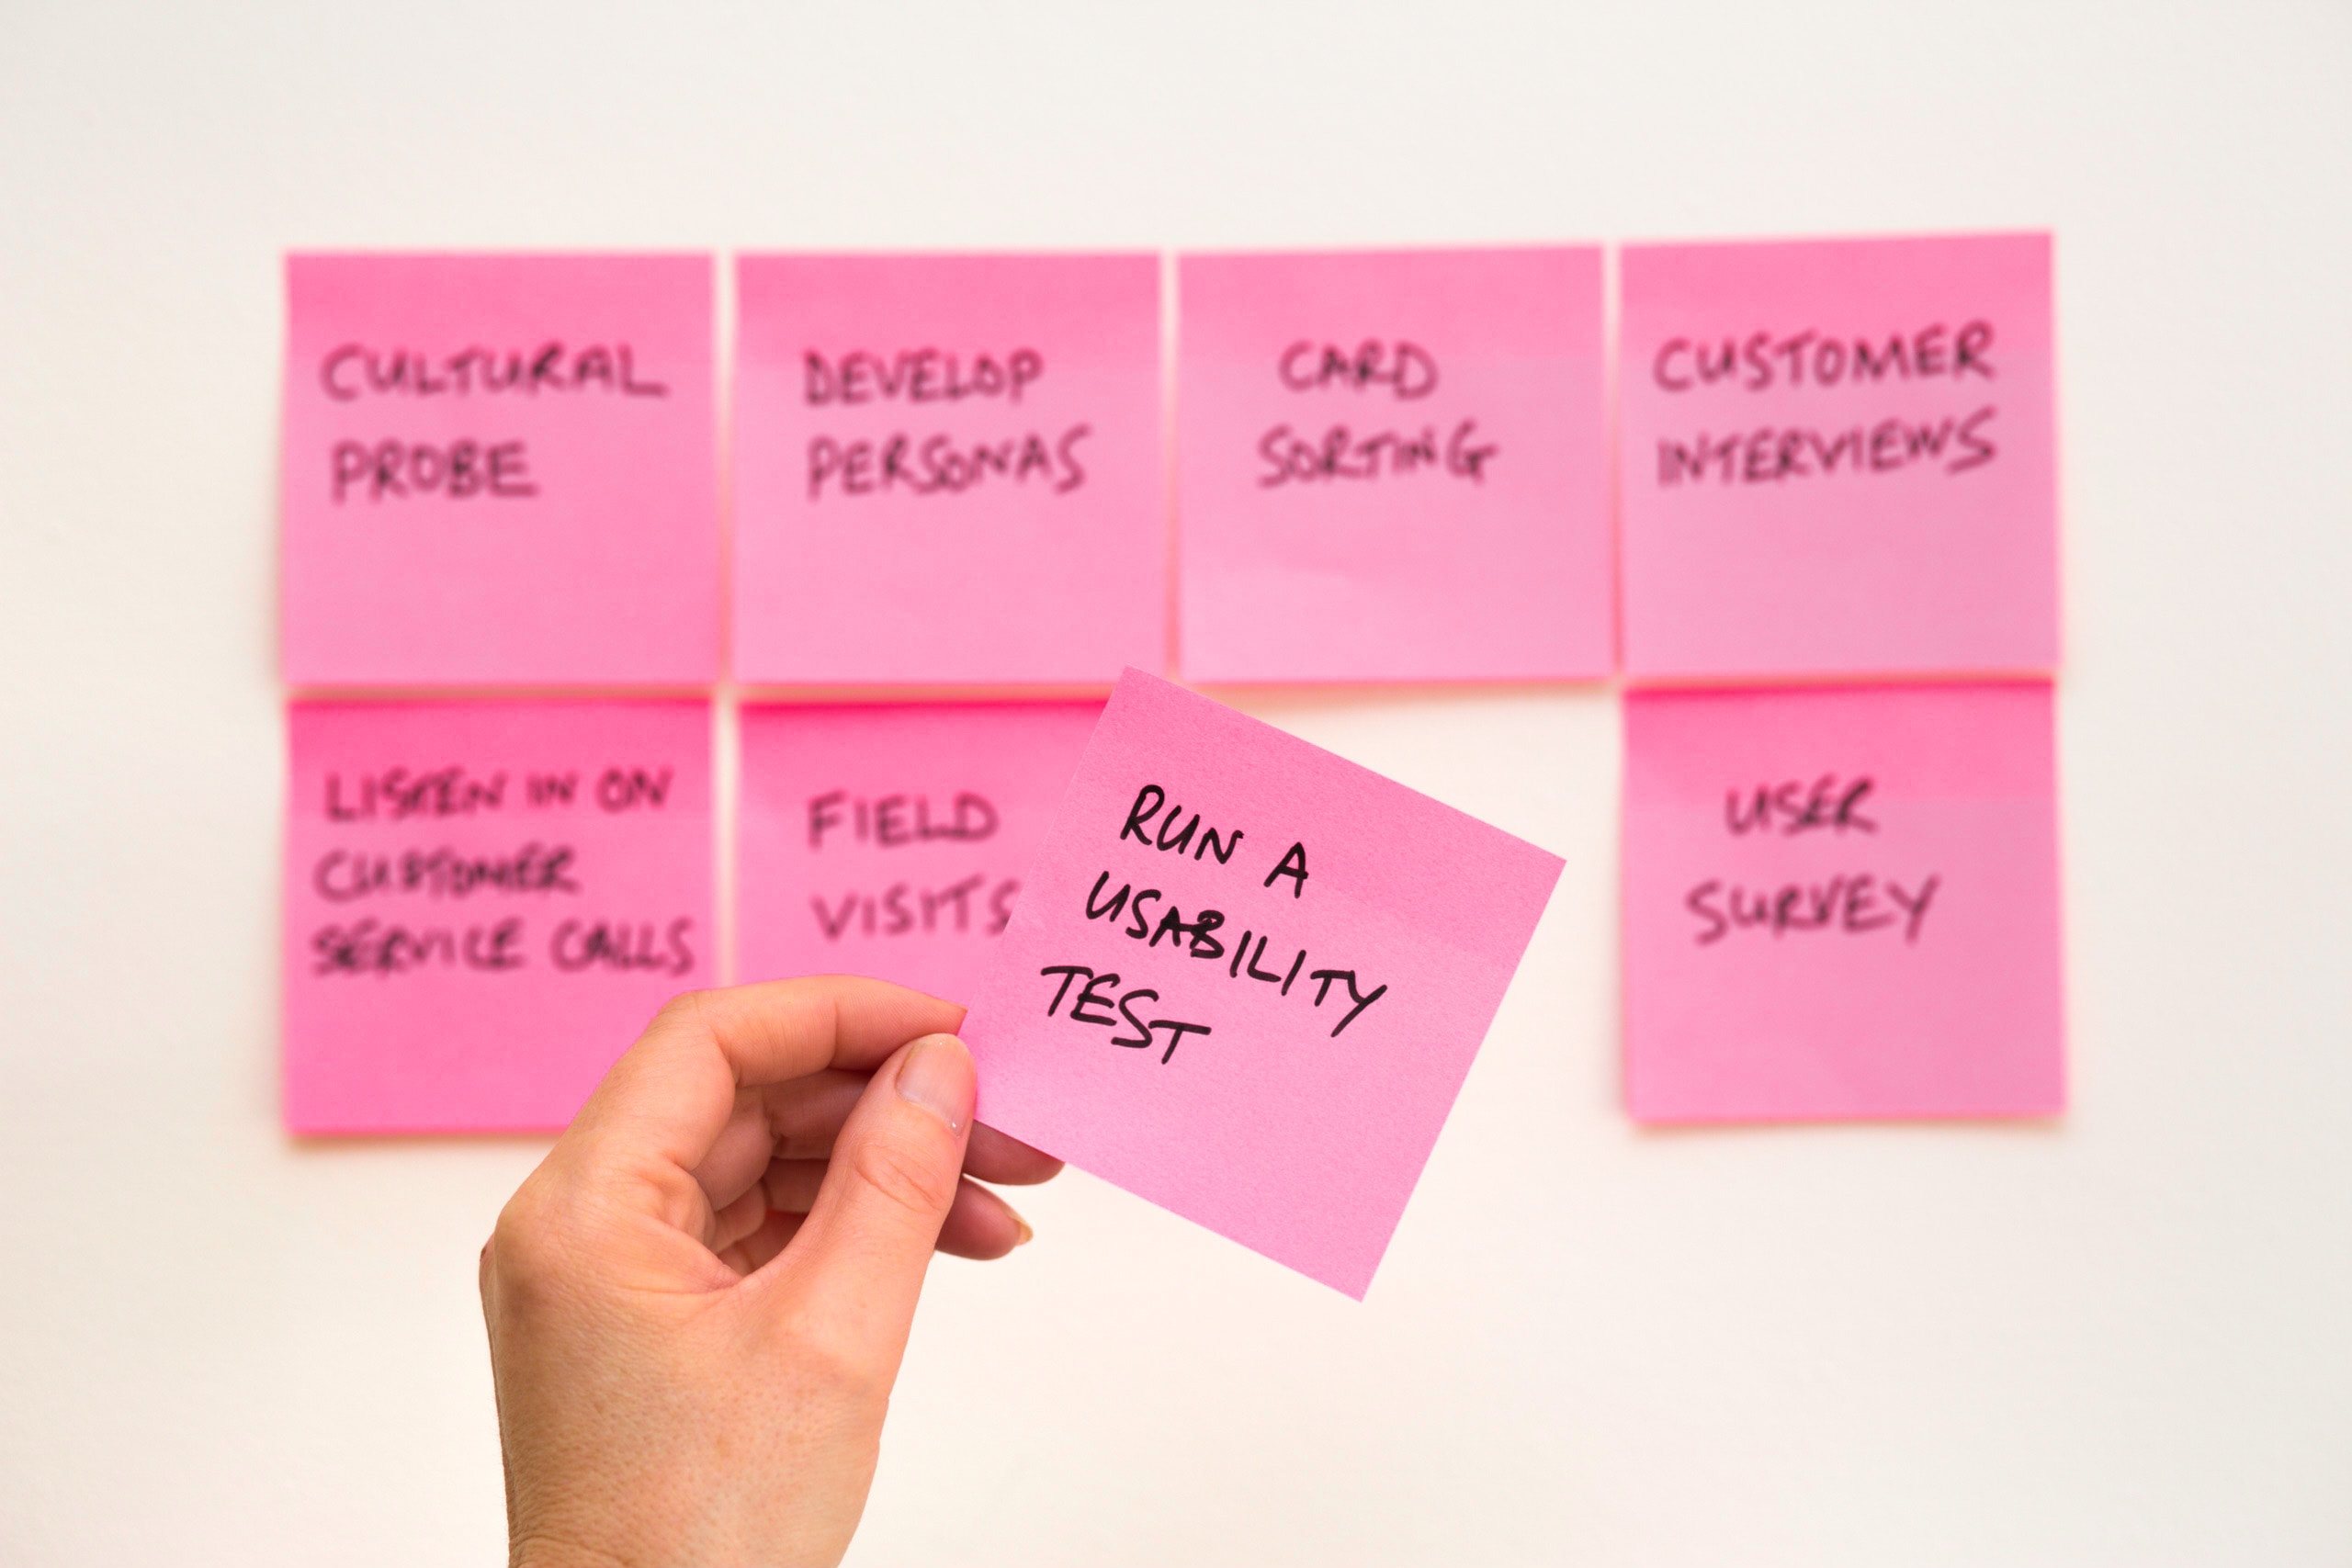
Here are the three most common and effective ways to gather this information:
Qualitative Research |
Customer Journey Mapping
|
| Surveys and Interviews
|
This method can help determine the attitudes of your clients, whilst gaining insight into their personal opinions of your brand. Helpful for generating personas.
|
| Web and Exit Surveys
|
This method is designed to get real-time reactions to aspects of your website. Helpful for understanding issues users face at certain touchpoints.
|
| Usability Testing
|
This method can give you similar information to that of both the above tests, whilst also allowing you to observe how user-friendly your site is. Helpful for seeing the whole process in regards to your webpage.
|
Interpreting Your Qualitative Data
When looking at the sum of your data to create your personas, pattern recognition is essential. Start first with goals and intentions, grouping each of these with associated hesitations and effective marketing techniques that correspond with established patterns. There could be any number of personas that you generate at this stage but try to keep them to a minimum, as the most effective customer journey maps focus on only one persona.
You will need to make a separate map for each persona you create. Some people at this stage decide to add physical attributes to their personas, with a name, age and gender. This may help to improve your visualisation of each persona as a real customer, but is not a necessary step to take.
Implementing Quantitative Data
Now that your personas have been created, use quantitative research to improve your view of their behaviours in a statistical sense. The segment function in Google Analytics will be an invaluable tool at this stage, as you can create segments based on the average revenue per customer, transactions per user, new versus repeat customers, as well as frequent customers.
Here is an overview of the benefits of different quantitative research methods:
Quantitative Research |
Customer Journey Mapping
|
| Numerical Survey Data
|
This can show the frequency and quantity of the behaviours associated with your personas.
|
| Numerical Customer Feedback
|
Summing feature requests and similar feedback can help determine areas that need improvement and new aspects to add.
|
| Digital Analytics
|
This can quantify pain points, detailing the frequency at which they cause issues for users.
|
| Social Sentiment Analysis
|
This can illustrate emotional responses to certain touchpoints, allowing you to focus on certain areas to improve the mapping process.
|
| Satisfaction Scores
|
Used to back up qualitative data with numerical evidence to view the extent of certain issues.
|
Combining these two data types will ensure your personas are not generalisations. Instead, they reflect the real attitudes and behaviours of your customers.
Step Two: The Phases of the User Journey
In this step, you need to determine the stages a customer goes through in relation to your company, from discovery to after-sales. This is not quite the same as touchpoints, as the aim at this stage is to discover how the user interacts at each general stage, not which specific touchpoints they interact with. Below is a sample customer journey map template you can use.
Customer Journey Map Template
This method is a great way to summarise the thought process surrounding your company’s personal customer journey map. The customer journey map template grid breaks down what you need to know about the consumer at each stage of interaction. This includes what tasks the user is trying to complete, what questions they may have, what touchpoints are present, what the user is feeling, what may influence the client’s purchasing decisions and what weaknesses your company has. Adding other elements that are more specific to your business can also be valuable.
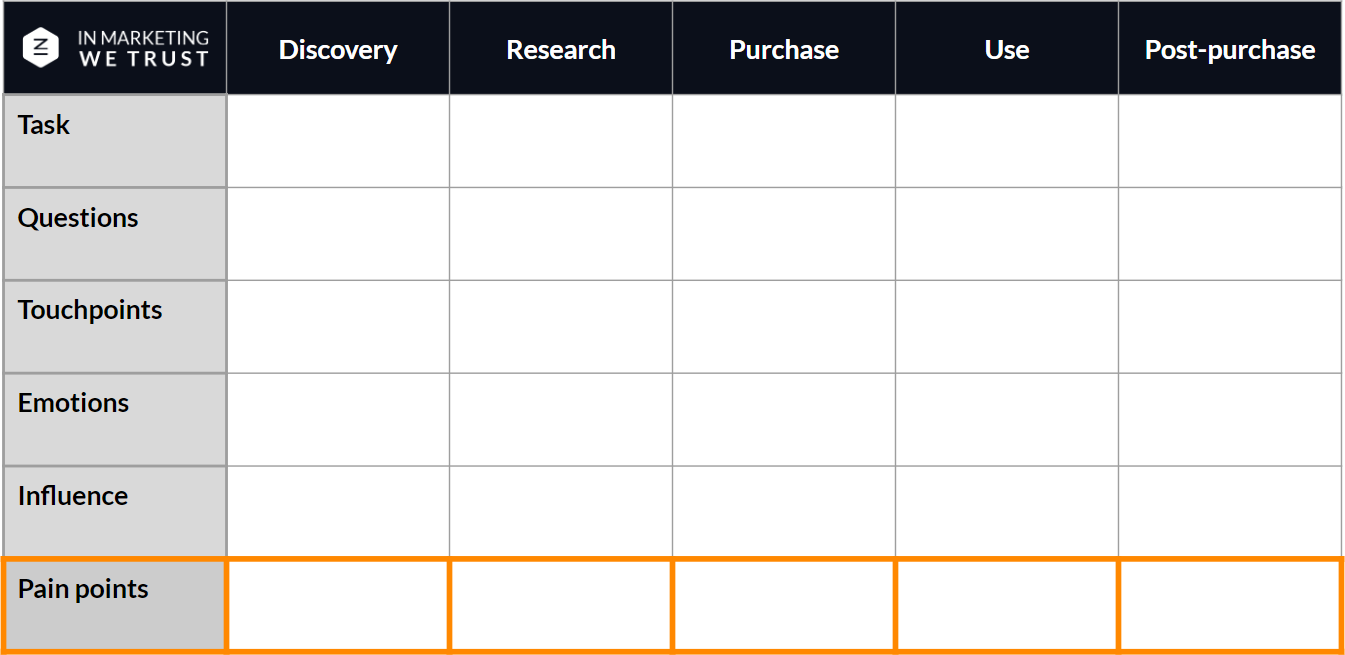
Fill out your version of the grid and add to it throughout as you gain more insight into your personas and how they interact with your brand.
Step Three: Customer Goals
This is a crucial step to ensure your customer journey map is a success. What would this user want to achieve at each phase of their journey? Culminate your above work in the table to create distinct goals for your personas.
Certain goals are universal, like researching what products are available, whilst others can be more specific to each persona. What is this person’s main motivation for choosing you over a competitor? Do they value low prices and quick shipping or are they more concerned with the ethical nature of your product?
Then, there are differences between new and existing customers, especially in terms of how they behave on your site. Do they browse your entire catalogue or do they use your search function?
Determining all these characteristics for your personas will not only help you to understand and appeal to your target market but identify which touchpoints will be experienced by each persona.
Step Four: Your Touchpoints
Any moment within the phases of the user journey where a customer is able to engage with your brand is a touchpoint. Each of these touchpoints need to be goal focussed and linked to the goals you established for each persona.
The first step is to work out what each of your touchpoints are. You can brainstorm the content you put out, including advertising, promotions and your website, as well as what others produce, including reviews and social media posts.
Some of your touchpoints could be:
Awareness |
Consideration |
Purchase |
Service |
Loyalty Loop |
| PR | Store | Self-service | Offers in invoice | |
| Radio | Social media | App | Community | Promotion |
| TV | Websites | Website | Chat | Blog |
| Paid content | Social | Newsletter | ||
| Word-of-mouth | Search | Call centre | Loyalty programs | |
| Online display |
Survey |
Google Analytics
Create a Behaviour Flow report and Goal Flow report in Google Analytics. The Behaviour Flow report will illustrate how users get to certain pages on your website and will show you which pages are difficult for users to find.
A Goal Flow report highlights whether your users are able to complete an action of your choosing and whether they give up or loop back on their progress during the task. This is essential, not only to identifying heavily trafficked touchpoints but where some pain points are as well.
Step Five: Your Pain Points
Now we move into the big picture, using everything you’ve discovered to identify the biggest problems. After going through your touchpoints, you should be able to identify which of these are not helping your users to complete their goals. Look at your analytics and other research to see where your customer’s goals and your company’s goals don’t align.
For example, you want them to buy your product and they need the product, but they frequently abandon you at the checkout page. Through your research, you should have worked out the reason for this and must plot out all the pain points in relation to one another.
Oftentimes there is a larger, overlying issue that connects many of these pain points and they can be of the greatest benefit to fix. Say you had a confusing website design, as illustrated by your usability testing and analytics. More than one pain point will be helped in improving the layout of your platform.
Analysing the behaviours of your customers in this way will allow you to see the issues that most negatively influence them. Improving this can significantly help your conversion rate optimisation.
Step Six: The Course of Action
You may find any number of significant and minor changes that need to be made through this process. However, major immediate upheaval of your platforms and marketing strategies is not practical.
Prioritising which touchpoints to improve first is essential to significant results with only gradual changes. The PIE framework can be a helpful way to do this.
PIE Framework
The PIE framework stands for Potential, Importance and Ease and is a method for comparing the need for certain changes to be made on your site.
Potential
The potential is how much you can improve the page, and those that are the worst-performing should be highly prioritised.
Importance
Importance represents how essential the traffic to these pages is. If an unimportant page is a low performer, it requires less attention than an important one.
Ease
Ease is how difficult it will be to implement these changes. The easier, the better.
Ranking the issues within your site based on PIE is a great way to distinguish between problems requiring immediate action, and those that do not.
How to Build a Customer Journey Map
Now it’s time to create a visual that encompasses all of these factors, from personas to final solutions.
Each of these steps, if completed in isolation, will give you a glimpse into certain aspects of the user experience. When brought together, a bigger picture unfolds, illustrating the entire journey a customer goes through and allows you to see the flaws in that process.
Streamlining, making your service more intuitive and easier to understand will help you to reach your clients more effectively, and will improve your CRO process. That is why the customer journey map is such an important part of understanding your clients and helping everyone to realise their goals.